oladoyemayowa@gmail.com

oladoyemayowa@gmail.com

Multi-year Retail Transaction

Completed Project 

Data Analytics.

Business Problem

The retail company experienced strong sales growth but struggled to convert revenue into high profitability. Management needed to identify the products, customers, regions, and categories driving profit and uncover areas of poor performance.

Key Results & Insights

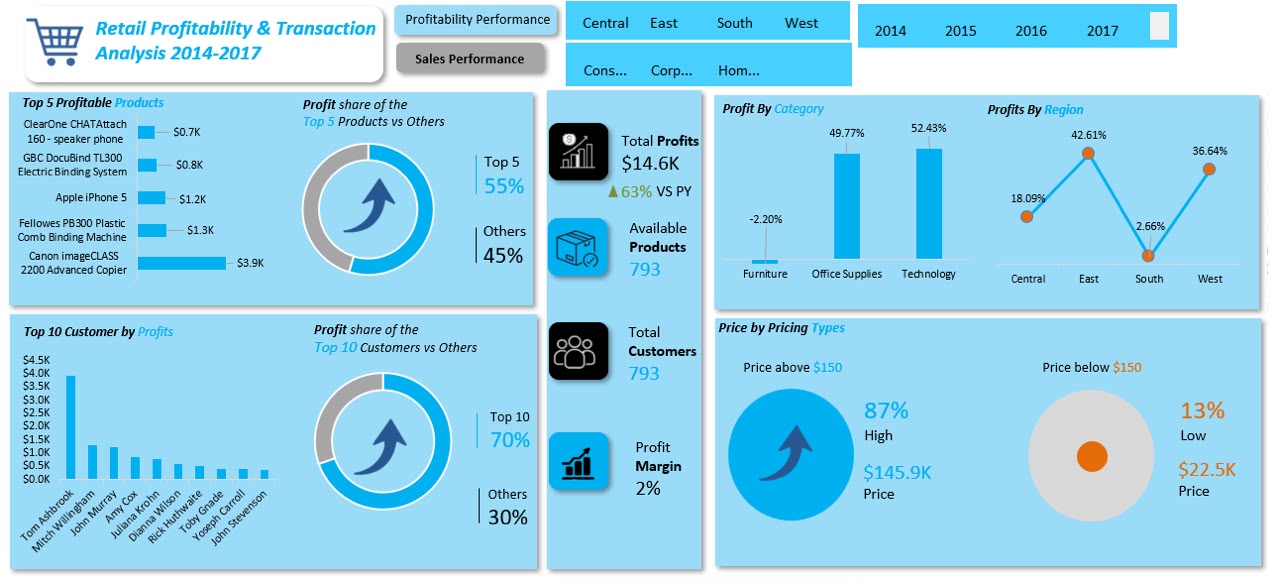
  • 2% overall profit margin identified, heavily suppressed by a negative profit margin of -2.20% in the Furniture category.
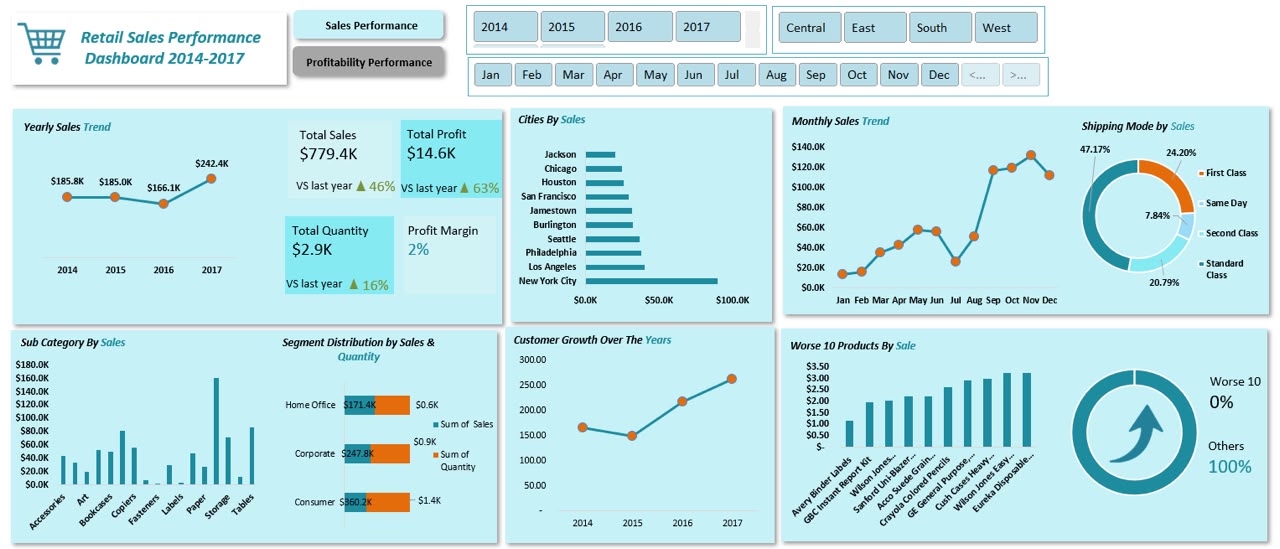
  • 2017 broke a 3-year revenue with a 46% spike in annual sales ($242.4K) and a 63% surge in year-over-year profits ($14.6K).
  • Top 5 products generate 55% of profits, exposing extreme revenue concentration led by premium products priced above $150 (accounting for 87% of total sales pricing volume).
  • Q4 seasonality trends identified with a massive, repeatable revenue surge starting in September and peaking across November and December.

What I Did

1.⁠ ⁠Collected and cleaned multi-year retail transaction records, ensuring data consistency across product attributes, sub-categories, shipping modes, and regional metrics.
2.⁠ ⁠Connected the dataset to Excel and built Pivot table measures for critical KPIs including profit margins, volume growth (16%), and year-over-year (YoY) financial trends.
3.⁠ ⁠Designed Page 1: Retail Sales Performance Dashboard to track monthly sales trends, active customer acquisition growth, sub-category distributions, and the worse 10 underperforming products.
4.⁠ ⁠Designed Page 2: Retail Profitability & Transaction Analysis focusing on asset concentration (Top 5 products vs. Top 10 customers), regional margin variances, and pricing thresholds.
5.⁠ ⁠Identified Furniture as a severe financial drag (-2.20% margin) and isolated New York City and the East/West regions as the company’s highest-yielding revenue engines.
6.⁠ ⁠Delivered insights enabling risk-free strategic growth, such as reallocating marketing spend away from low-performing regions (like the South at 2.66% profit) and creating targeted loyalty paths for the Top 10 clients who drive 70% of total profits.

Cart (0 items)
Select the fields to be shown. Others will be hidden. Drag and drop to rearrange the order.
  • Image
  • SKU
  • Rating
  • Price
  • Stock
  • Availability
  • Add to cart
  • Description
  • Content
  • Weight
  • Dimensions
  • Additional information
Click outside to hide the comparison bar
Compare