MTN Nigeria | Customer Churn Analysis Report – Q1 2026
Completed Project
Data Analytics.
- Power BI.
- DAX.
- SQL.
- KPI Reporting.
- Data Visualization.
Business Problem
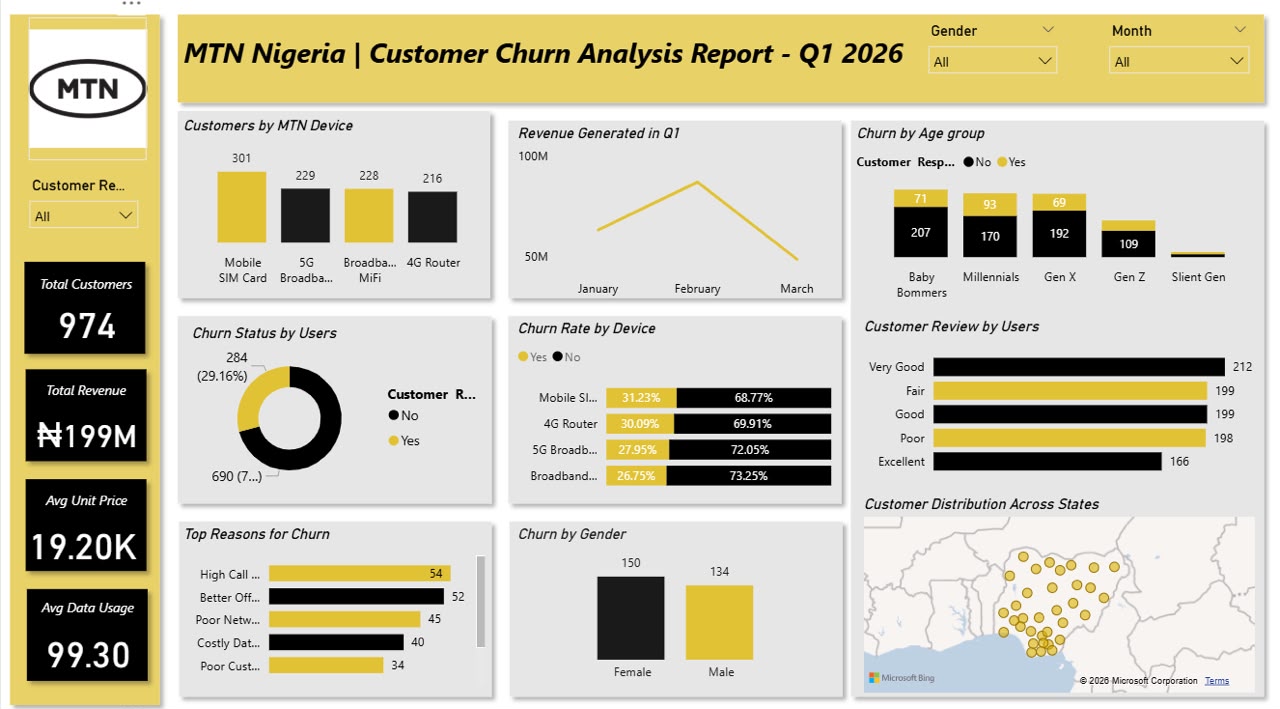
I discovered that MTN Nigeria was experiencing a high customer churn rate of 29.2%, putting customer retention and revenue growth at risk. I also found that churn was not evenly distributed across customer segments, indicating that specific customer groups, devices, and service issues required targeted intervention.
Key Results & Insights
- ₦199M in total revenue analyzed across Q1 2026
- 29.16% subscriber churn rate tracked (284 total churned users)
- Interactive multi-demographic and device performance breakdown
- Q1 revenue peaked sharply in February but experienced a significant downward trajectory heading into March, correlating heavily with the ongoing customer drop-off.
What I Did
- Extracted and structured telecom subscriber data using SQL queries across customer profiles, usage data, and feedback records.
- Developed DAX formulas in Power BI to calculate dynamic KPIs, including churn rates, customer segment counts, and average data usage.
- Analyzed churn distribution across age groups (Millennials exhibiting the highest attrition at 93 users) and device types.
- Created an interactive, highly professional dashboard covering seasonal revenue trends, churn drivers, and customer feedback distribution across Nigerian states.
- Identified high-risk triggers—specifically high call rates and superior competitor offers—to provide actionable insights for customer retention strategies.