HR Dashboard
Completed Project
Data Analytics.
- Power BI.
- DAX.
- KPI Reporting.
- HR & Workforce Analytics
- Data Visualization.
Business Problem
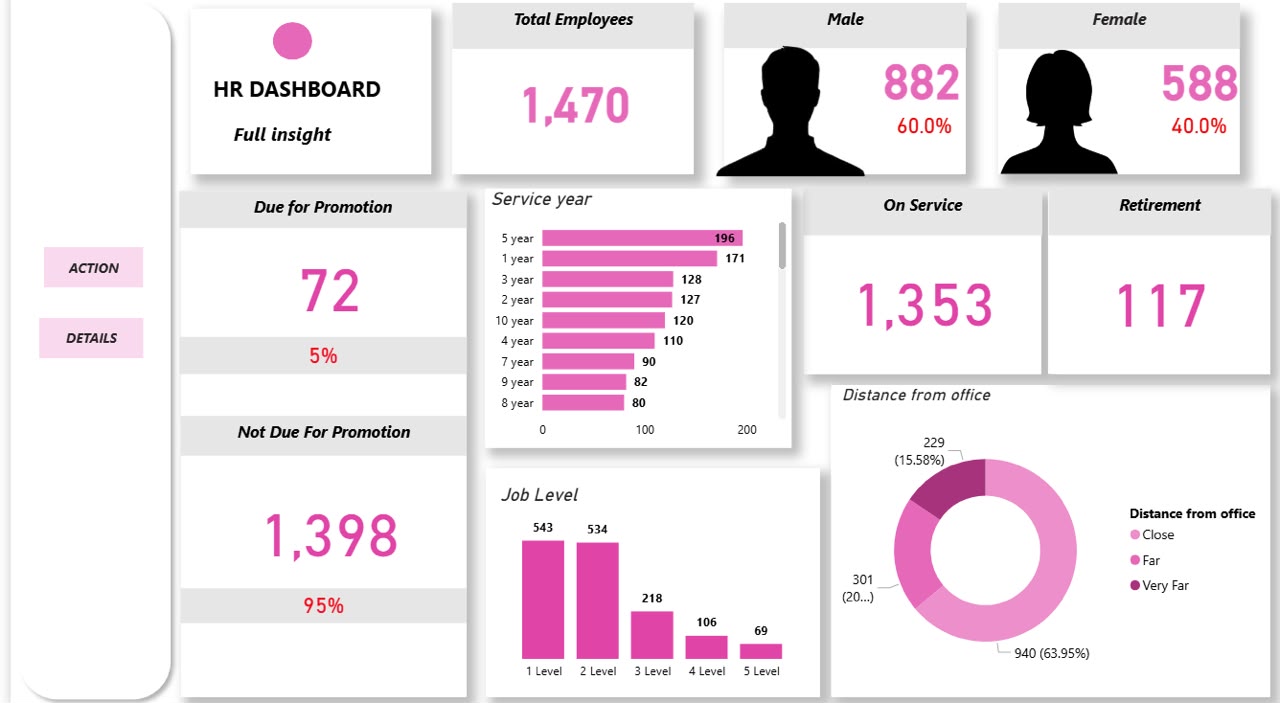
I discovered that the organization had promotion readiness, retirement planning, and workforce distribution challenges. While employee satisfaction was generally high, a significant number of employees were approaching retirement, only a small proportion were eligible for promotion, and workforce composition varied across departments and job levels. These findings highlighted potential succession planning and talent management risks.
Key Results & Insights
- 1,470 total active personnel monitored, maintaining a 60% male and 40% female gender split
- 72 employees (5%) identified as due for promotion against 117 employees (8%) reaching retirement eligibility
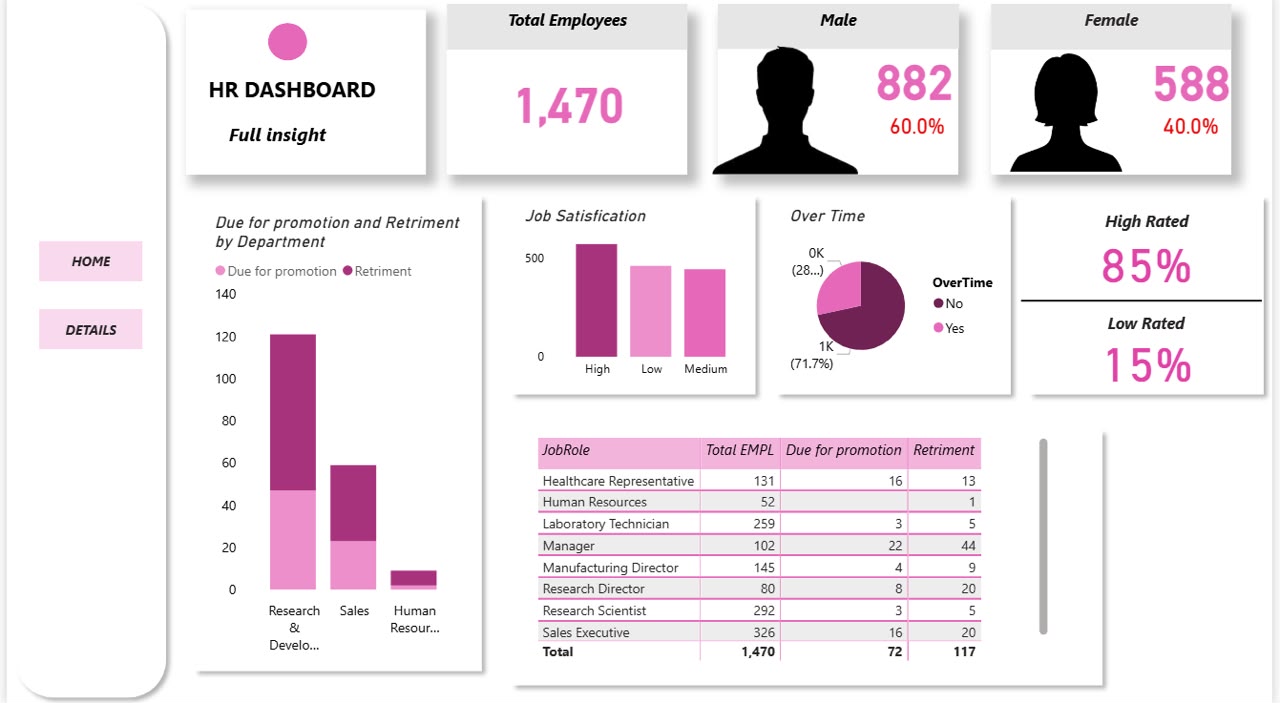
- High-density operational risks surfaced in Research & Development and Sales departments regarding tenure stagnation and impending attrition.
What I Did
- . Extracted and cross-referenced organizational workforce data using SQL queries to consolidate employee job roles, satisfaction levels, and service tenures.
- Developed custom DAX measures in Power BI to calculate dynamic HR targets, including active promotion flags, retirement criteria, and over-time distributions.
- Analyzed departmental tenure structures and job roles to pinpoint where backlogs existed (e.g., identifying 44 managers due for retirement).
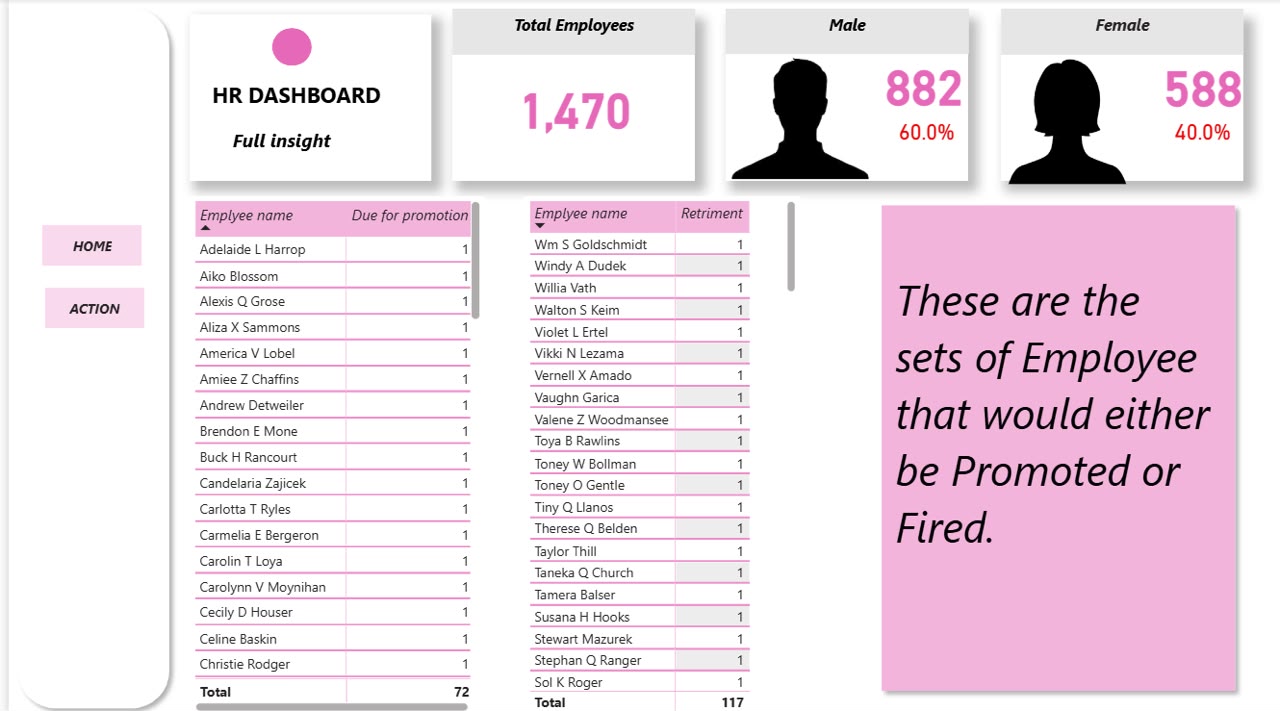
- Designed an interactive, multi-view Power BI dashboards with page navigation, demographic slicers, and drill-down lists.
- Delivered structured workforce planning lists to provide leadership with immediate, actionable rosters for promotional tracks and retirement replacement positioning.