Healthcare Resources & Patient Outcome Insights
Completed Project
Data Analytics.
- Power BI.
- DAX.
- Data Visualization.
- EDA.
- Healthcare Analytics.
- Data Visualization.
Business Problem
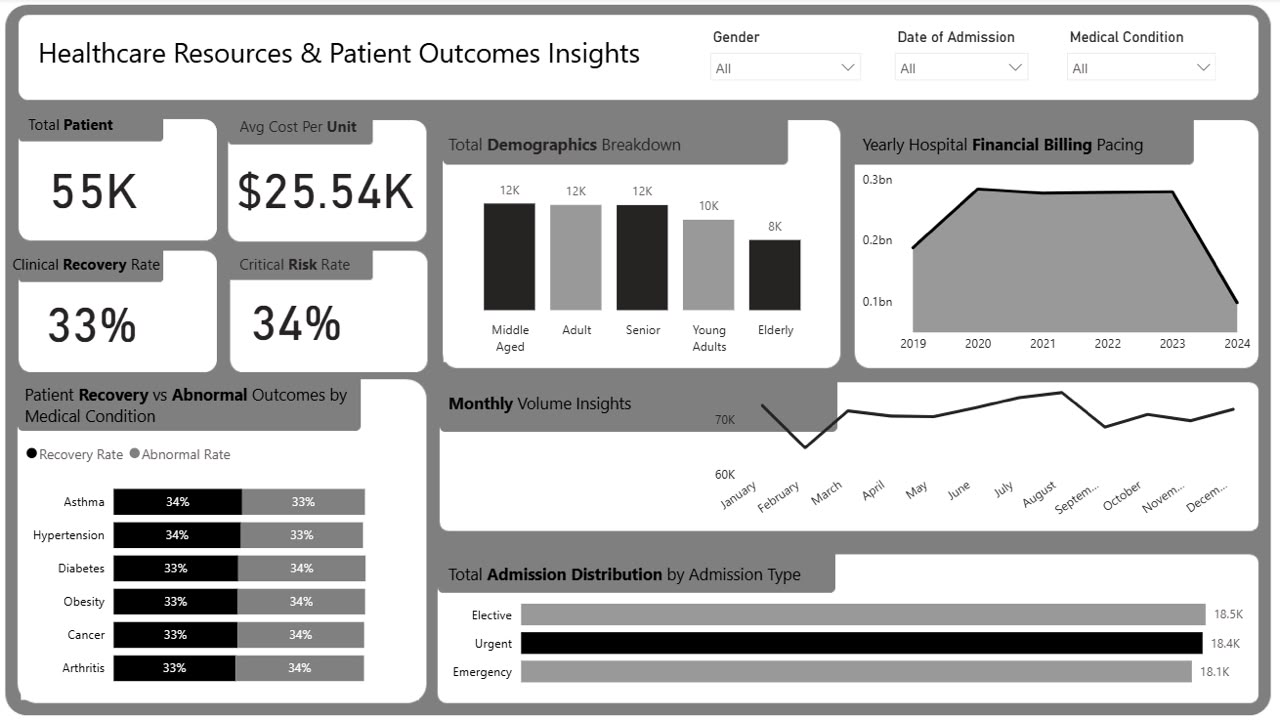
I discovered that although the hospital was managing a high patient volume (55K patients), clinical outcomes remained relatively low, with a 33% recovery rate and a 34% critical risk rate. I also identified fluctuations in financial performance and patient admissions, indicating opportunities to improve resource allocation, patient care, and operational efficiency.
Key Results & Insights
- 55,000+ patient records cleaned to analysis standard
- Clinical recovery and financial billing KPIs tracked
- Seasonal volume fluctuations and patient outcome risks surfaced
What I Did
- Cleaned 55,000+ rows of complex healthcare data in Power BI, handling inconsistencies, missing entries, and medical condition categorizations.
- Developed dynamic DAX measures and filters for real-time reporting by demographic segments, admission types, and specific diagnoses.
- Tracked critical performance KPIs: hospital financial billing pacing, average unit costs ($25.54K), clinical recovery rates, and critical risk indices.
- Designed a fully interactive Power BI dashboard with integrated multi-chart layouts, timeline trends, and granular cross-filtering capabilities.
- Delivered operational insights that isolated consistent risk factors across primary health conditions and identified peak monthly volume trends to improve resource allocation.