oladoyemayowa@gmail.com

oladoyemayowa@gmail.com

Dangote Cement: 2024 Commercial & Logistics Intelligence

Completed Project 

Data Analytics.

Business Problem

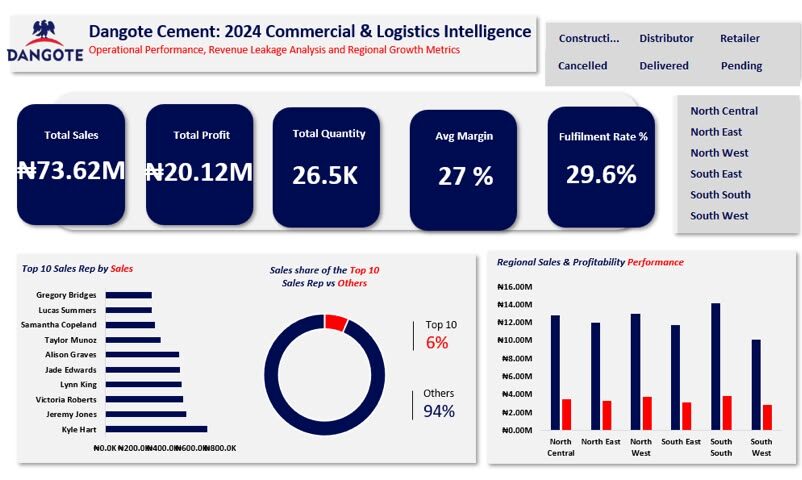
I discovered that although Dangote Cement generated ₦73.62M in sales and maintained a 27% profit margin, operational performance was uneven across regions, customer segments, and delivery outcomes. I identified opportunities to improve sales concentration, fulfillment efficiency, and regional performance to drive sustainable revenue growth.

Key Results & Insights

  • ₦70.7M revenue and ₦19.3M profit analyzed with 27.3% average margin
  • 163 cancellations against 170 deliveries exposed a critical logistics revenue leak
  • South South identified as the most profitable region, challenging existing resource allocation

What I Did

1.⁠ ⁠Cleaned and structured the full 2024 commercial and logistics dataset in Excel, standardizing regional codes, customer types, delivery statuses, and sales rep data.

2.⁠ ⁠Built Pivot Tables to calculate total revenue (N70.7M), total profit (N19.3M), average margin (27.3%), total quantity sold (25.4K tonnes), and fulfilment rate (30%).

3.⁠ ⁠Mapped revenue and profitability across all six Nigerian geopolitical zones to identify where the business was genuinely making money versus where resources were being misdirected.

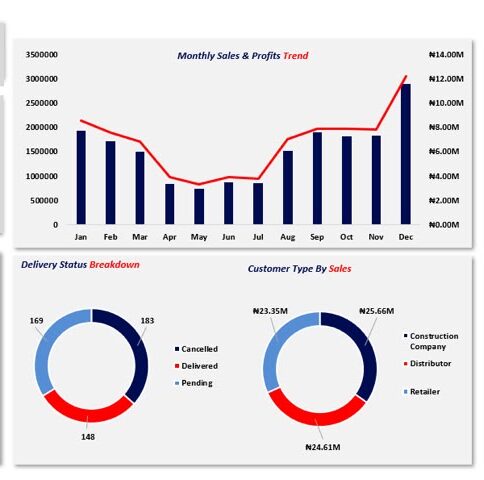
4.⁠ ⁠Analyzed customer type revenue across Retailers (N24.5M), Construction Companies (N23.7M), and Distributors (N22.4M) to surface segment-level margin and operational differences.

5.⁠ ⁠Broke down delivery performance to reveal that 163 orders were cancelled against only 170 successfully delivered, flagging a critical logistics leak draining realized revenue.

6.⁠ ⁠Tracked the top 5 sales reps by individual contribution and built monthly revenue and profit trend charts to reveal seasonal patterns and months where costs outpaced growth.

7.⁠ ⁠Designed an interactive Excel dashboard with product category, regional, and customer type filters for executive-ready, decision-driven reporting.


Key Findings

  1. South South was the most profitable region by absolute profit at N13.7M, despite not always leading in raw revenue. Resource allocation based on revenue alone was directing attention to the wrong zones.
  2. The cancellation rate was critically high. With 163 cancellations against 170 successful deliveries, nearly half of all order activity was not resulting in realized revenue.
  3. Delivery and logistics operations were the single biggest controllable leak in the business.
  4. Retailer customers generated the highest revenue segment at N24.5M but required deeper margin analysis to confirm whether their contribution was proportional to the cost of serving them versus Distributors.
  5. Sales performance was heavily concentrated in the top two reps, who together contributed over N400K. Scaling the business without addressing this concentration would create a fragile growth structure.
  6. Monthly profit trends confirmed that the Q4 push in November and December drove the strongest combined revenue and margin performance, pointing to an opportunity to accelerate that pattern earlier in the year.

What This Means for the Business

Revenue reporting tells you what happened. This analysis tells you why it happened and what to do next. The combination of regional profitability mapping, delivery performance tracking, customer segment breakdown, and sales rep contribution data gives leadership a complete intelligence view rather than a single headline number.
Decisions that follow from this analysis include reallocating logistics resources to reduce the cancellation rate, adjusting regional sales strategy to prioritize South South and South West, and building a sales development program around the underperforming reps to reduce concentration risk.

Dashboard Features

  • Regional performance bar charts showing revenue and profit side by side across all six zones
  • Customer type revenue donut chart with three-segment breakdown
  • Delivery status donut chart showing delivered, cancelled, and pending volumes
  • Top 5 sales rep horizontal bar chart with individual contribution values
  • Monthly revenue and profit trend with dual-axis line and bar combination chart
  • Product category filter covering Bagged Cement, Bulk Cement, Clinker, and Construction Company types
  • Regional filter covering all six geopolitical zones
  • Customer type filter for Distributor and Retailer segments
Cart (0 items)
Select the fields to be shown. Others will be hidden. Drag and drop to rearrange the order.
  • Image
  • SKU
  • Rating
  • Price
  • Stock
  • Availability
  • Add to cart
  • Description
  • Content
  • Weight
  • Dimensions
  • Additional information
Click outside to hide the comparison bar
Compare