Coffee Shop Sales and Revenue Insights/2021 -2023
Completed Project
Data Analytics.
- Microsoft Excel.
- Pivot Tables.
- Data Cleaning.
- KPI Reporting.
- Advanced Formulas.
- Dashboard Design.
Business Problem
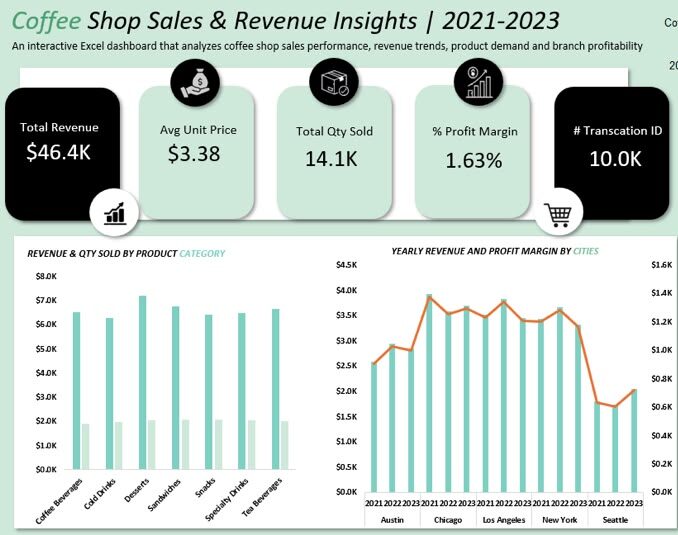
I discovered that although the coffee shop generated steady revenue across multiple locations, profitability remained low, with a profit margin of just 1.63%. I also identified differences in branch performance, product demand, and seasonal sales trends, revealing opportunities to improve pricing, product mix, and branch profitability.
Key Results & Insights
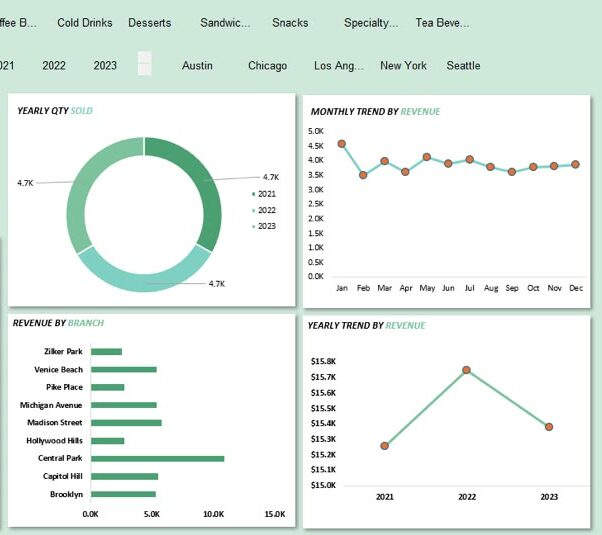
- Multi-year revenue and item quantity sales trends visualized
- Product category and geographic branch breakdown by city performance
- Macro-level data pipeline built from raw transaction logs to visual metrics
What I Did
- Cleaned and structured raw point-of-sale transaction logs in Excel, handling unique transaction IDs and pricing anomalies.
- Built Pivot Tables to aggregate total revenue, average unit prices ($3.38), and profit margins by product category and region.
- Created interactive charts tracking monthly revenue trends, product distribution comparisons, and historical yearly pacing.
- Designed slicers allowing users to filter effortlessly by operating year, specific city branches, and primary menu categories.
- Transformed the raw transaction log into a clean, decision-ready retail analytics dashboard to isolate profitability bottlenecks.